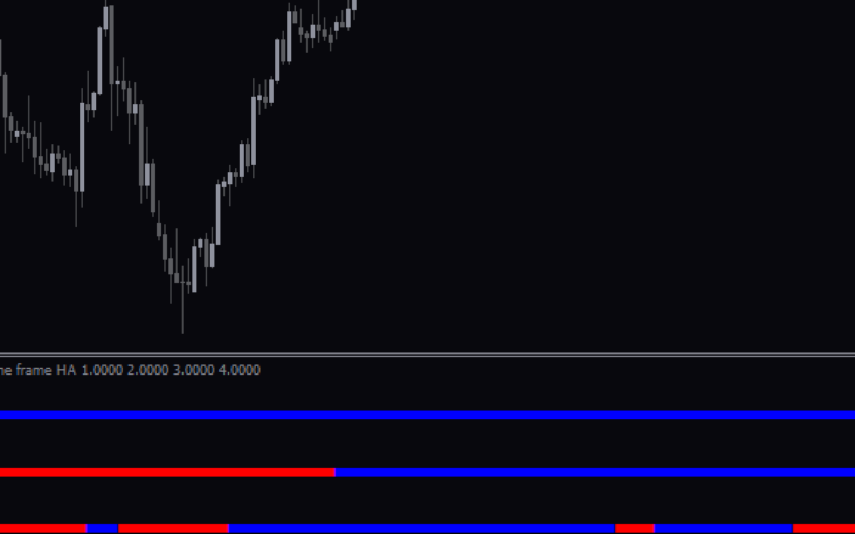
The 4 Timeframe Heiken Ashi Indicator has emerged as a valuable and popular free tool for traders using the MetaTrader 4 (MT4) platform. This innovative indicator is designed to help traders identify trends in the market by combining the open, high, low, and close prices of the previous bar to form a new, smoothed bar.
The key feature of the Indicator is its ability to analyze the market across four different time frames. By providing traders with a comprehensive view of the market’s behavior, this indicator empowers them to make more informed trading decisions.
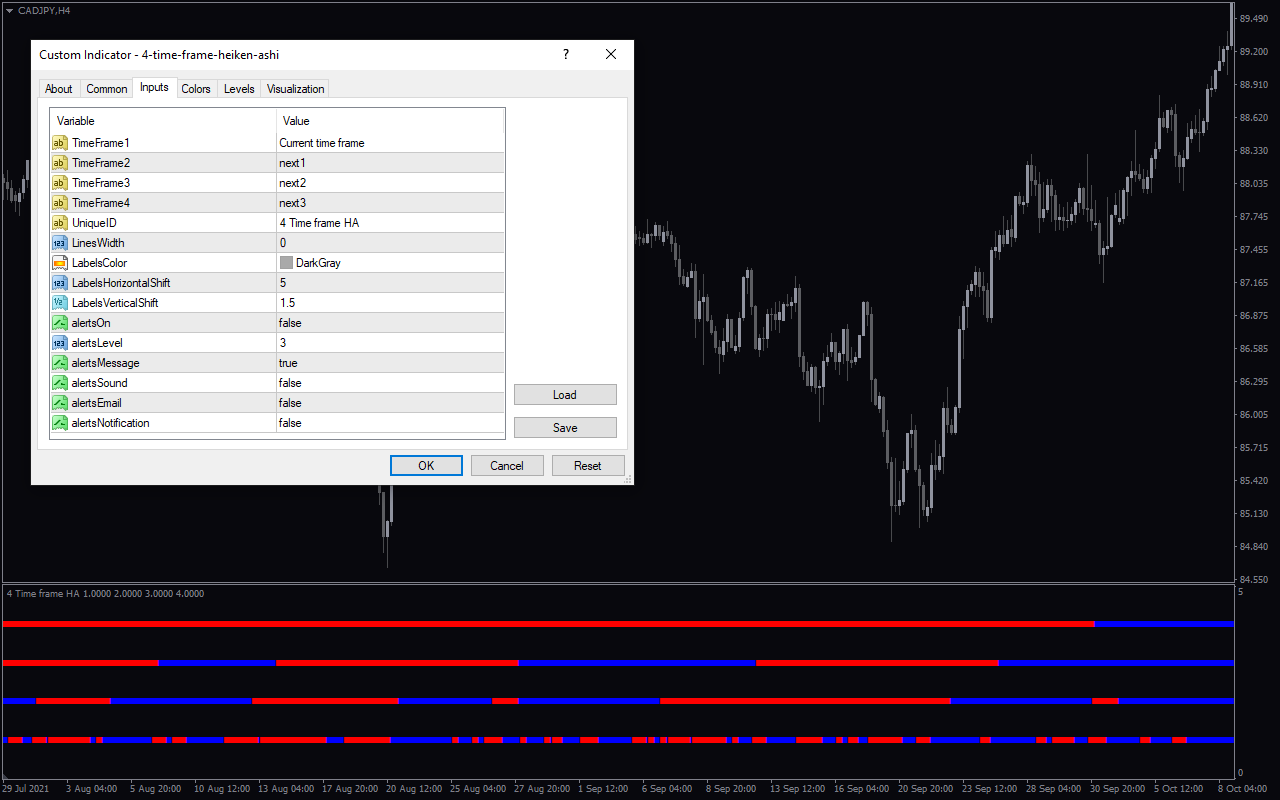
The indicator uses the Heiken Ashi smoothing technique to generate a new bar, which is then used to identify the strength and direction of the market’s trend. This is visually represented by the use of blue and red squares, where blue squares indicate an uptrend and red squares suggest a bearish trend.
The ability to analyze the market across multiple time frames is particularly valuable for traders who are looking to identify and capitalize on long-term trends. By understanding the market’s behavior on a deeper level, traders can adjust their trading strategies more effectively, potentially improving their risk-reward ratios.
The 4 Timeframe Heiken Ashi Indicator offers a range of benefits to Forex traders, regardless of their experience level or trading style. By providing a comprehensive and user-friendly solution for identifying market trends, this tool empowers traders to make more informed buy and sell decisions, potentially enhancing their overall trading performance.
For traders who are focused on identifying and capitalizing on long-term market trends, the 4 Timeframe Heiken Ashi Indicator can be a valuable asset. By analyzing the market across four different time frames, traders can gain a better understanding of the market’s overall direction, allowing them to time their entries and exits more effectively.
Additionally, the indicator’s ability to provide clear and concise visual cues can be particularly useful for traders who are looking to refine their trading strategies. By understanding the market’s behavior on a deeper level, traders can adjust their risk management strategies more effectively, potentially improving their risk-reward ratios.
Timeframe1-4: These settings allow you to specify the time frame(s) that the indicator should use for its calculations. The default value is the current timeframe being displayed on the chart.
Location Settings.
Color Settings.
Alert Settings.
The 4 Timeframe Heiken Ashi Indicator is a powerful and free tool that can revolutionize the way traders approach the Forex market. By offering a comprehensive and user-friendly solution for identifying market trends, this indicator gives traders the edge they need to succeed in the fast-paced trading environment. Whether you’re looking to refine your existing trading strategy or explore new avenues for growth, the 4 Timeframe Heiken Ashi Indicator is a must-have addition to your trading arsenal. Download the indicator for free and unlock the full potential of the Forex market.


