Chuyên mục lưu trữ: Scalping

ADX Smoothed

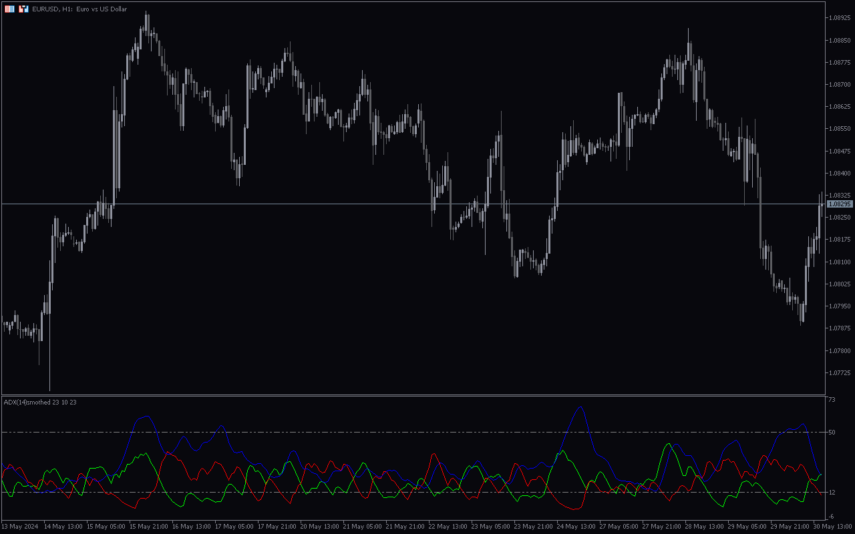
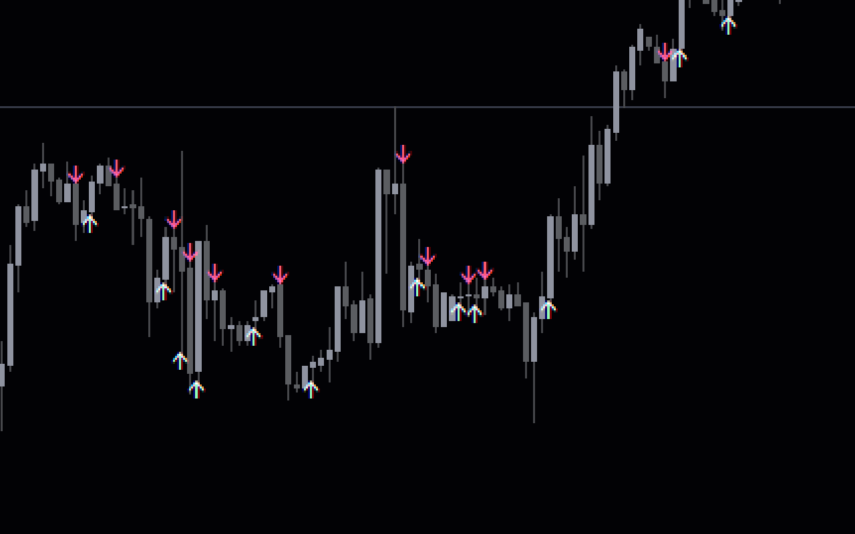
The ADX Smoothed Indicator for MT5 is a useful tool for forex traders looking to analyze market trends. This popular indicator is designed to help traders identify the strength of a trend, making it easier to determine when to enter or exit a trade. The ADX Smoothed Indicator works by smoothing the typical ADX calculation, providing a clearer picture of market momentum. Traders can use this indicator to confirm the strength of a trend, as well as identify potential reversals. To use the ADX Smoothed Indicator, simply add it to your MT5 chart and adjust the settings to your preference. A reading above 25 typically indicates a strong trend, while a reading below 20 suggests a weak trend. By incorporating this indicator into your trading strategy, you can improve your decision-making process and potentially increase your profits. And the best part is, it’s completely free to use.


💯 Nếu bạn muốn tham gia giao dịch trên thị trường Forex, Vàng,…. bạn hãy ủng hộ admin bằng cách đăng ký sàn theo link dưới nha! Cảm ơn bạn rất nhiều 😘😘😘

🏆 Sàn Exness: https://one.exnesstrack.net/a/6meoii18rp
🥇 Mã giới thiệu: 6meoii18rp

Adx MTF Indicator

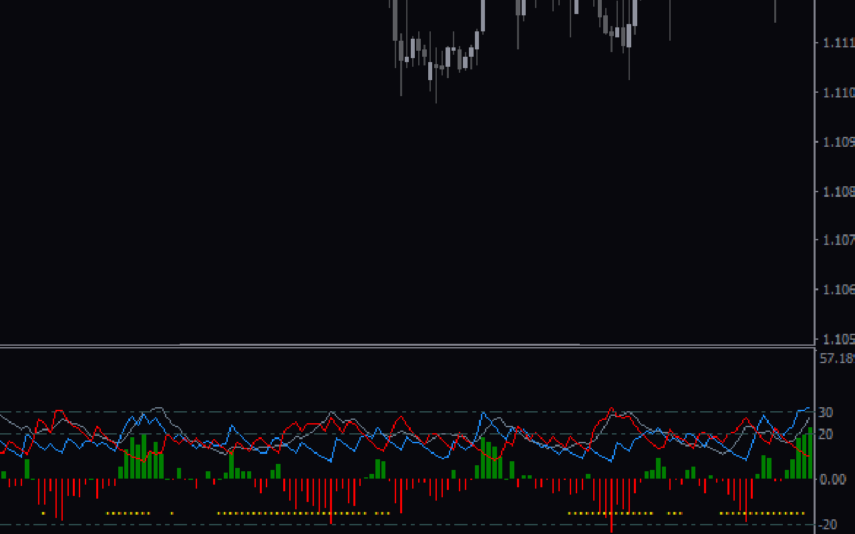
The ADX MTF Indicator is a useful and popular free Forex indicator for the MT4 platform. It is designed to help traders identify trend strength, and can be used to determine when a trend is likely to reverse. The indicator works by measuring the Average Directional Movement Index (ADX) of a currency pair, and displaying the results in multiple time frames. This allows traders to see the trend strength across multiple time frames, and to identify when the trend is likely to reverse. The ADX MTF Indicator is easy to use and understand. It displays the ADX in a separate window, with a histogram showing the trend strength. The histogram shows the ADX in relation to the current time frame, as well as in relation to higher and lower time frames. This allows traders to quickly identify the trend strength and decide when it is likely to reverse. It is easy to use and understand, and is a popular tool among Forex traders.


💯 Nếu bạn muốn tham gia giao dịch trên thị trường Forex, Vàng,…. bạn hãy ủng hộ admin bằng cách đăng ký sàn theo link dưới nha! Cảm ơn bạn rất nhiều 😘😘😘

🏆 Sàn Exness: https://one.exnesstrack.net/a/6meoii18rp
🥇 Mã giới thiệu: 6meoii18rp

ADX Lucki

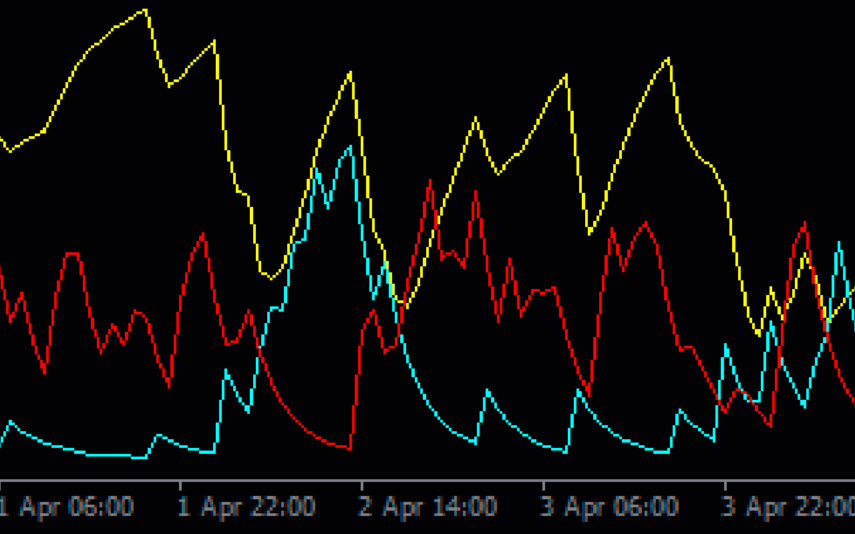
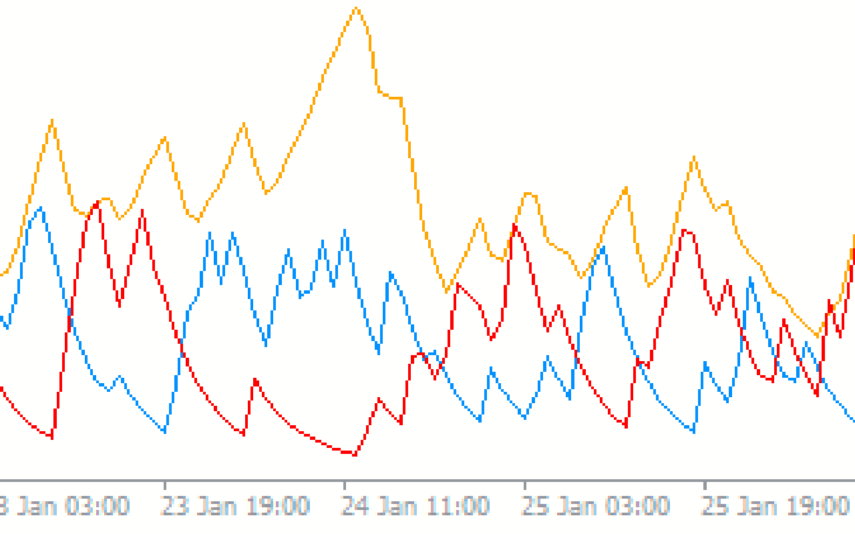
The ADX Lucki Indicator is a useful and popular free Forex indicator for the MT4 platform. It is designed to help traders identify trending markets and determine the strength of a trend. The indicator uses the ADX (Average Directional Movement Index) to measure the strength of a trend and the Directional Movement Index (DMI) to identify the direction of the trend. The ADX Lucki Indicator is composed of two lines, a blue line and a red line. The blue line is the ADX line and it indicates the strength of a trend. The red line is the DMI line and it indicates the direction of the trend. When the ADX line is above 25, it is an indication of a strong trend and when it is below 25, it is an indication of a weak trend. The DMI line is used to identify the direction of the trend. When the line is above 0, it is an indication of an uptrend and when it is below 0, it is an indication of a downtrend. The indicator is free and can be downloaded from the MT4 platform. It is a popular and useful indicator that can help traders make better trading decisions.


💯 Nếu bạn muốn tham gia giao dịch trên thị trường Forex, Vàng,…. bạn hãy ủng hộ admin bằng cách đăng ký sàn theo link dưới nha! Cảm ơn bạn rất nhiều 😘😘😘

🏆 Sàn Exness: https://one.exnesstrack.net/a/6meoii18rp
🥇 Mã giới thiệu: 6meoii18rp

ADX K Period

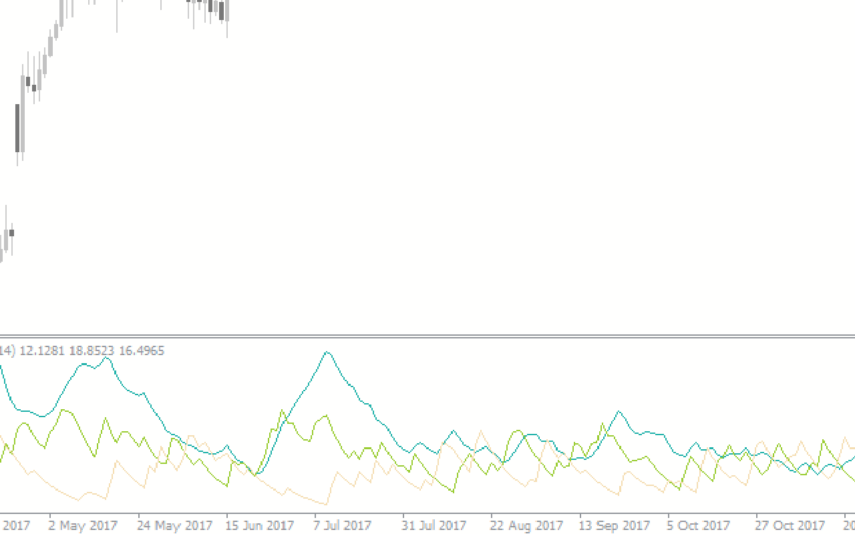
The ADX K-Period Indicator is a popular and useful tool for forex traders using the MT4 platform. This free indicator helps traders analyze the strength and direction of a trend in the market. The ADX K-Period Indicator measures the average change in price over a specified time period, typically 14 days. The indicator ranges from 0 to 100, with values above 25 indicating a strong trend and values below 20 indicating a weak trend. Traders can use the ADX K-Period Indicator to identify potential entry and exit points in the market. When the indicator is rising, it suggests that the trend is getting stronger, while a falling ADX indicates that the trend may be weakening. Overall, the ADX K-Period Indicator is a valuable tool for forex traders looking to gauge the strength of a trend and make more informed trading decisions.


💯 Nếu bạn muốn tham gia giao dịch trên thị trường Forex, Vàng,…. bạn hãy ủng hộ admin bằng cách đăng ký sàn theo link dưới nha! Cảm ơn bạn rất nhiều 😘😘😘

🏆 Sàn Exness: https://one.exnesstrack.net/a/6meoii18rp
🥇 Mã giới thiệu: 6meoii18rp

Adx Cross Hull Style

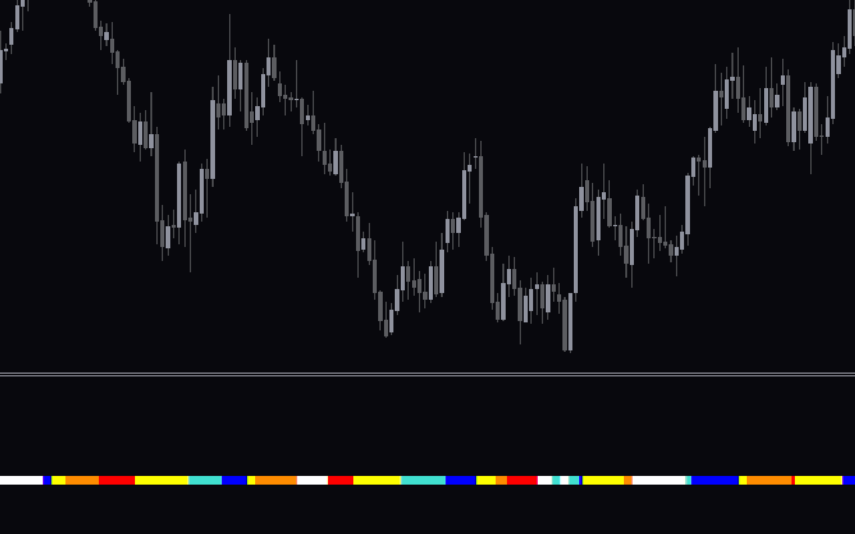
The ADX Cross Hull Style Indicator for MT4 is a popular and free Forex indicator that is useful for traders looking to get an edge in the market. This indicator is based on the Hull Moving Average and the Average Directional Index (ADX) indicator, two popular and reliable indicators used by Forex traders. The ADX Cross Hull Style Indicator for MT4 is designed to provide traders with a visual representation of the market trend and momentum. The indicator plots the Hull Moving Average and ADX on the chart, with the Hull Moving Average providing the trend direction and the ADX providing the momentum. The indicator also includes a histogram that displays the difference between the Hull Moving Average and ADX, which can be used to identify potential buy and sell signals. The ADX Cross Hull Style Indicator for MT4 is easy to use and can be used in any timeframe. The indicator is designed to be used with other indicators and can be used in combination with other strategies. Traders can use the indicator to identify potential buy and sell signals, and to confirm the trend direction and momentum of the market. The indicator can also be used to identify potential support and resistance levels and to identify potential entry and exit points.


💯 Nếu bạn muốn tham gia giao dịch trên thị trường Forex, Vàng,…. bạn hãy ủng hộ admin bằng cách đăng ký sàn theo link dưới nha! Cảm ơn bạn rất nhiều 😘😘😘

🏆 Sàn Exness: https://one.exnesstrack.net/a/6meoii18rp
🥇 Mã giới thiệu: 6meoii18rp

Adx Buy Sell

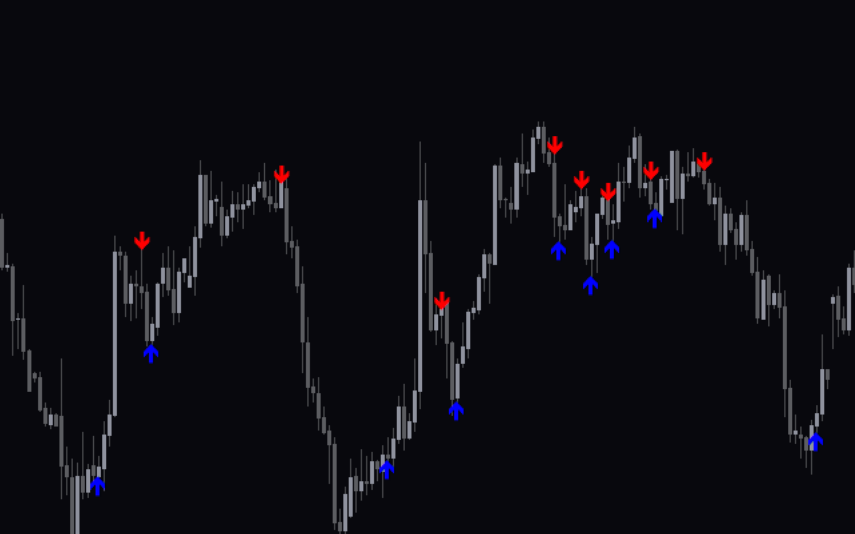
The ADX Buy Sell Indicator is a valuable tool for technical forex trading strategy. It provides clear buy and sell signals, indicated by arrows, that traders can use to enter and exit positions based on market trends. By using the Average Directional Movement Index (ADX), this indicator helps traders identify trend strength and make informed trading decisions. This indicator provides simple buy and sell signals with colored arrows.

The ADX Buy Sell indicator simplifies the process of trend identification by eliminating the need to analyze complex ADX lines. Instead, traders can easily visualize the buy and sell signals on the chart, allowing for quick assessment of market conditions.

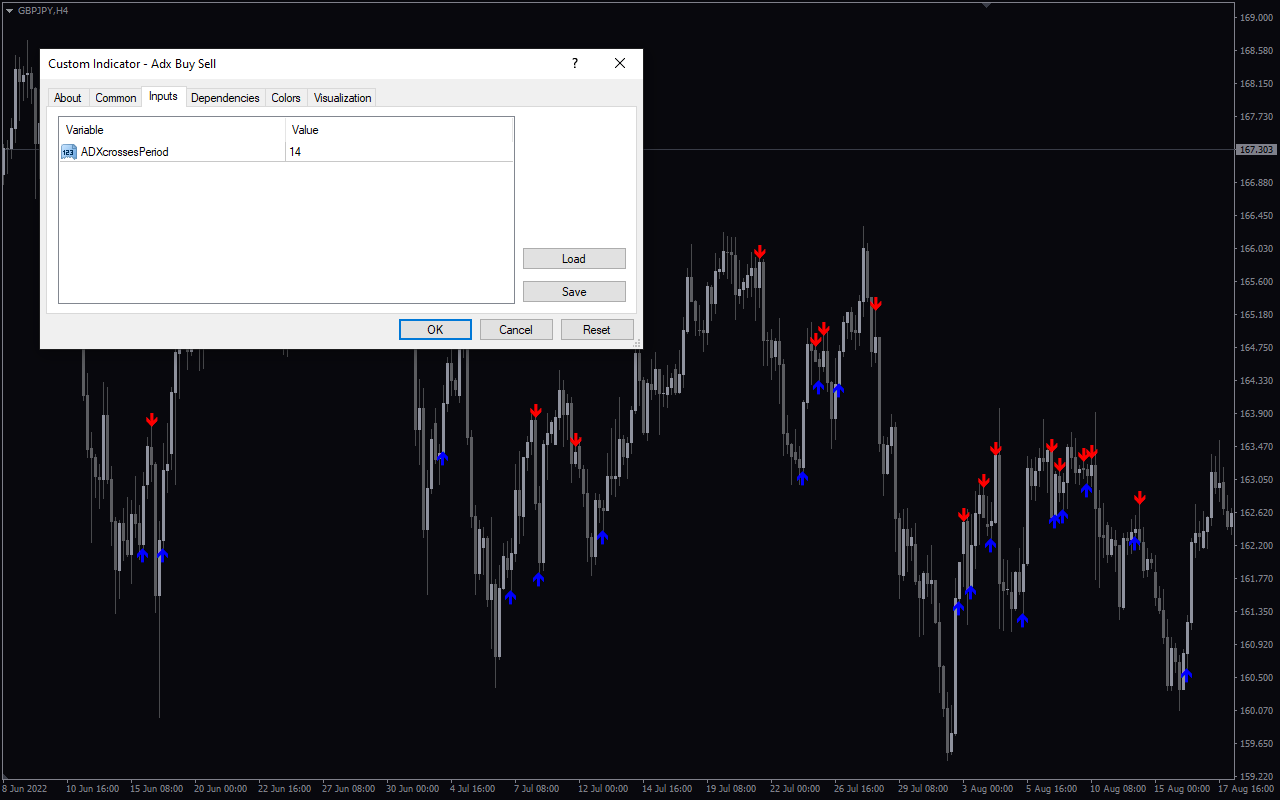
The indicator generates the buy and sell signals through the use of arrows. A blue arrow indicates a buy signal, suggesting that traders should consider entering a long position. Conversely, a red arrow signifies a sell signal, suggesting that traders should consider entering a short position.

The signals are based on changes in market momentum, measured by the ADX. When the ADX line crosses above a certain level (e.g., 14), it generates a buy signal with a blue arrow. Conversely, when the ADX line crosses below that level, a sell signal with a red arrow is generated.

The ADX Buy Sell indicator offers several benefits to traders. Firstly, it simplifies the process of trend identification, reducing the need for complex analysis. Additionally, the clear and actionable signals provided by the arrows minimize guesswork and allow for more disciplined trading decisions.

Traders can time their trades more effectively with the help of this indicator, entering positions at the beginning of trends and exiting before reversals. This can enhance profitability and mitigate the impact of market fluctuations.
Adx Buy Sell

ADXcrossesPeriod: The Period used to calculate the indicator. By default, it is set to 14. Nonetheless, currency traders have the flexibility to experiment with various periods for different currency pairs to assess their effectiveness.

Overall, the ADX Buy Sell Indicator is a best tool for forex traders seeking a straightforward approach to trend identification. By incorporating this indicator into their trading strategy, traders can enhance their performance and increase their chances of success in the dynamic forex market.


💯 Nếu bạn muốn tham gia giao dịch trên thị trường Forex, Vàng,…. bạn hãy ủng hộ admin bằng cách đăng ký sàn theo link dưới nha! Cảm ơn bạn rất nhiều 😘😘😘

🏆 Sàn Exness: https://one.exnesstrack.net/a/6meoii18rp
🥇 Mã giới thiệu: 6meoii18rp

Adx Alert Play Blue

The ADX Alert Play Blue Indicator is a popular and useful forex indicator that is compatible with MT4. This indicator is free to use and helps traders identify the strength of a trend in the market. When the ADX line crosses above the threshold set by the user, a blue arrow will appear on the chart, indicating a strong trend. This can help traders make more informed decisions about when to enter or exit a trade. The ADX Alert Play Blue Indicator is easy to use and can be customized to suit individual trading preferences. Traders can adjust the threshold levels and choose whether or not to receive alerts when a strong trend is detected. Overall, this indicator is a valuable tool for forex traders looking to capitalize on market trends.


💯 Nếu bạn muốn tham gia giao dịch trên thị trường Forex, Vàng,…. bạn hãy ủng hộ admin bằng cách đăng ký sàn theo link dưới nha! Cảm ơn bạn rất nhiều 😘😘😘

🏆 Sàn Exness: https://one.exnesstrack.net/a/6meoii18rp
🥇 Mã giới thiệu: 6meoii18rp

Advanced Bollinger Bands

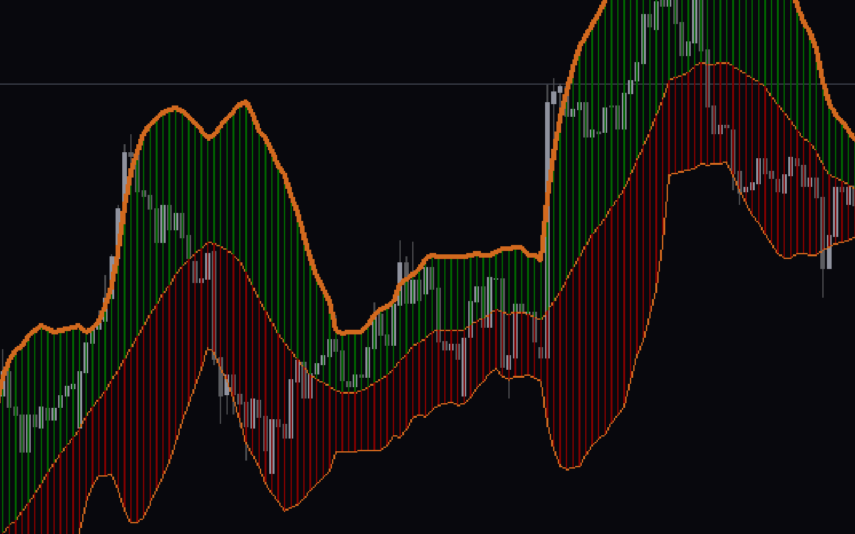
Advanced Bollinger Bands Indicator is a popular and free forex indicator for MT4 that offers a wide range of useful features. This indicator is designed to measure market volatility and identify possible trends. It uses two bands, a simple moving average and a standard deviation, to plot the price action of a currency pair. The bands are drawn around the simple moving average, and the distance between the bands is determined by the standard deviation. The upper band shows the maximum price level, while the lower band shows the minimum price level. The Advanced Bollinger Bands Indicator is useful for traders because it helps them identify possible entry and exit points. The indicator can also be used to identify whether the market is in a trend or range-bound. When the bands are wide, it indicates a volatile market. When the bands are narrow, it indicates a market that is consolidating. With its user-friendly features and reliable signals, the Advanced Bollinger Bands Indicator is an indispensable tool for any trader looking to maximize their profits in the forex market.


💯 Nếu bạn muốn tham gia giao dịch trên thị trường Forex, Vàng,…. bạn hãy ủng hộ admin bằng cách đăng ký sàn theo link dưới nha! Cảm ơn bạn rất nhiều 😘😘😘

🏆 Sàn Exness: https://one.exnesstrack.net/a/6meoii18rp
🥇 Mã giới thiệu: 6meoii18rp

Adaptable Stoch RSI Arrows

Adaptable Stoch RSI Arrows Indicator is a useful Forex indicator for MetaTrader 4 (MT4) that helps traders identify buy and sell opportunities. This popular free indicator is based on the Stochastic Relative Strength Index (RSI) and uses arrows to indicate potential trading opportunities. The indicator is highly adaptable and can be used for any currency pair and timeframe. It is easy to use and requires no additional configuration. The Adaptable Stoch RSI Arrows Indicator works by analyzing the current market conditions and generating arrows that indicate potential buy or sell opportunities. When a buy arrow is generated, it indicates that the price is likely to increase. Conversely, when a sell arrow is generated, it indicates that the price is likely to decrease. The indicator also provides an overview of the current market trend and can be used to identify potential entry and exit points. The indicator provides an overview of the current market trend and can be used to identify potential entry and exit points.


💯 Nếu bạn muốn tham gia giao dịch trên thị trường Forex, Vàng,…. bạn hãy ủng hộ admin bằng cách đăng ký sàn theo link dưới nha! Cảm ơn bạn rất nhiều 😘😘😘

🏆 Sàn Exness: https://one.exnesstrack.net/a/6meoii18rp
🥇 Mã giới thiệu: 6meoii18rp
Absolute Strength Market Arrows

The Candle Time and Spread Indicator for MT4 is a popular and useful tool for forex traders that displays the time remaining for the current candle to close, as well as the current spread for the currency pair being traded. This free indicator helps traders make better trading decisions by providing important information about market volatility and timing. The indicator works by showing a countdown timer on the chart, indicating how much time is left before the current candle closes. This can be especially helpful for day traders who rely on specific timeframes for their trading strategies. Additionally, the spread indicator shows the difference between the bid and ask price of a currency pair, helping traders gauge market liquidity and potential profitability. To use the Candle Time and Spread Indicator, simply download and install it on your MT4 platform. Once activated, the indicator will appear on your chart, providing real-time data on candle closure times and spreads. By staying informed about these key market factors, traders can make more informed decisions and maximize their trading potential.


💯 Nếu bạn muốn tham gia giao dịch trên thị trường Forex, Vàng,…. bạn hãy ủng hộ admin bằng cách đăng ký sàn theo link dưới nha! Cảm ơn bạn rất nhiều 😘😘😘

🏆 Sàn Exness: https://one.exnesstrack.net/a/6meoii18rp
🥇 Mã giới thiệu: 6meoii18rp