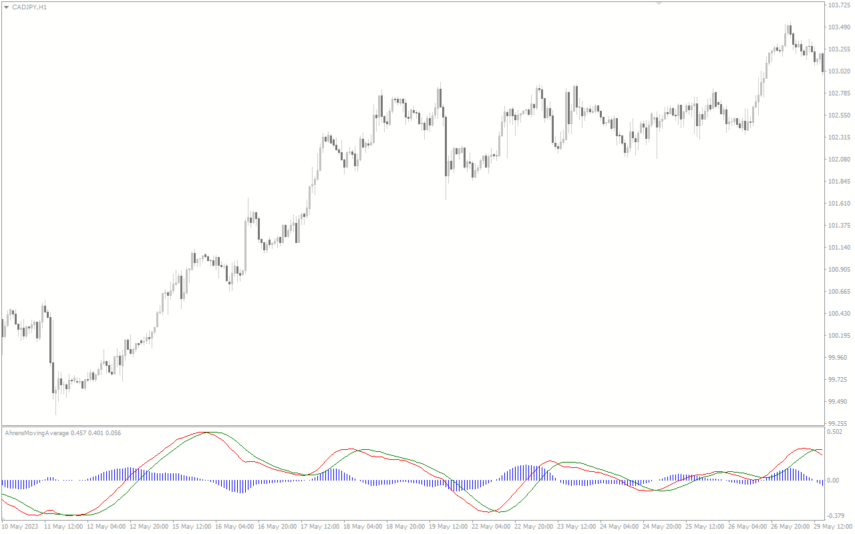
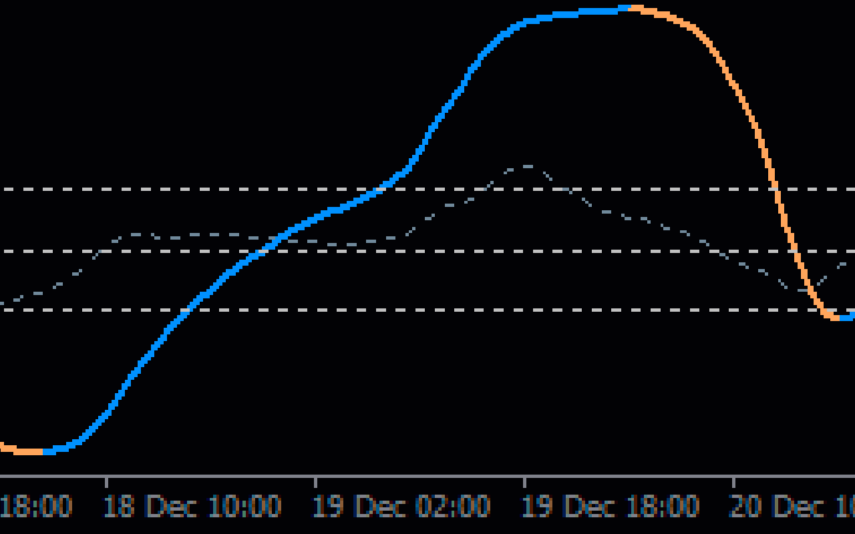
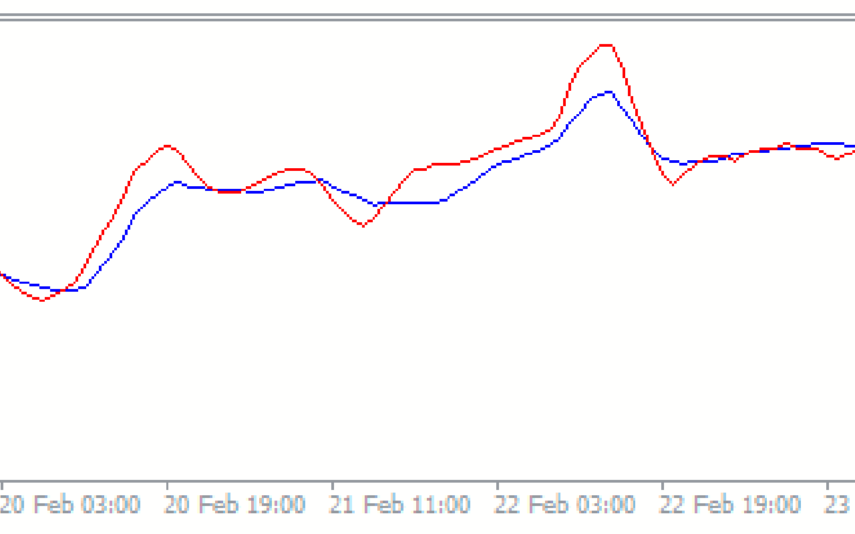
The Advanced RSI indicator for MT4 is one of the most advanced versions of the traditional RSI indicator. Unlike the regular RSI, which only displays trend information for a single time frame, the Advanced RSI allows traders to view the RSI reading across multiple timeframes simultaneously.
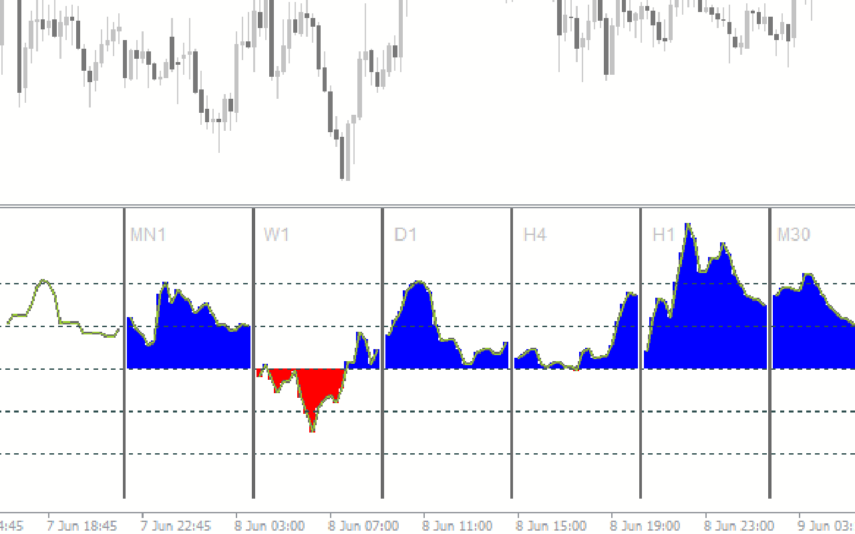
Therefore, this RSI version displays the RSI reading of multiple timeframes on a single price chart. Besides, it is designed to simultaneously display the RSI reading of multiple timeframes with different colors for easy readability and identification. Thus, it reduces the stress of switching between different timeframes to assess the RSI reading.
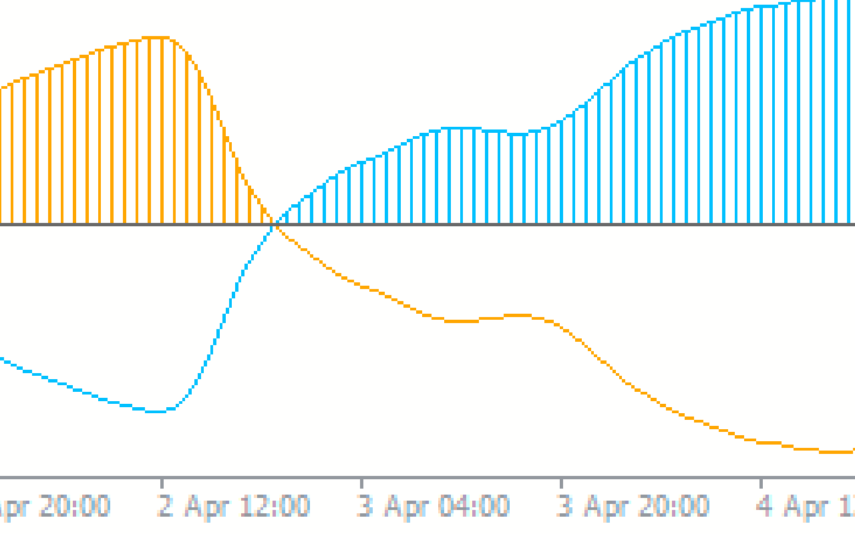
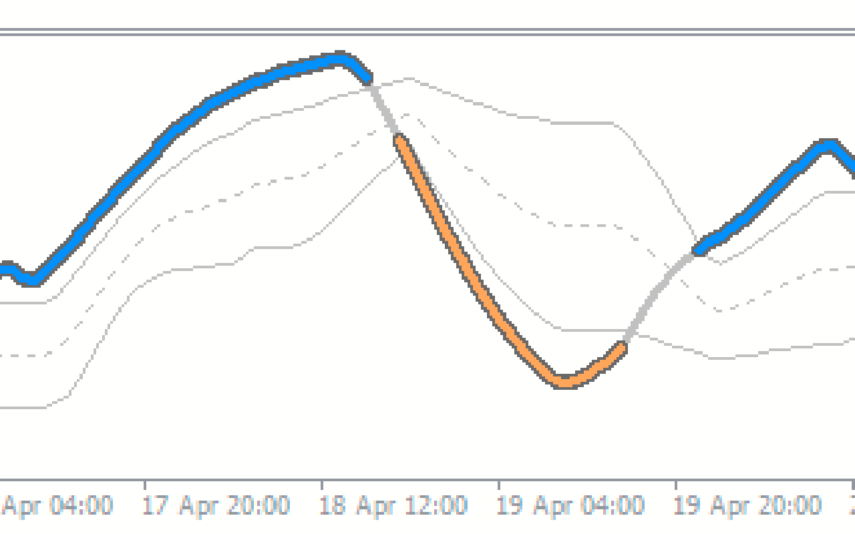
The indicator is built with different colors of lines that oscillate below the main chart. Each line represents the RSI reading for a particular time frame. For example, the white, green, and yellow lines represent the RSI reading for the H1, H4, and D1 timeframes, respectively.
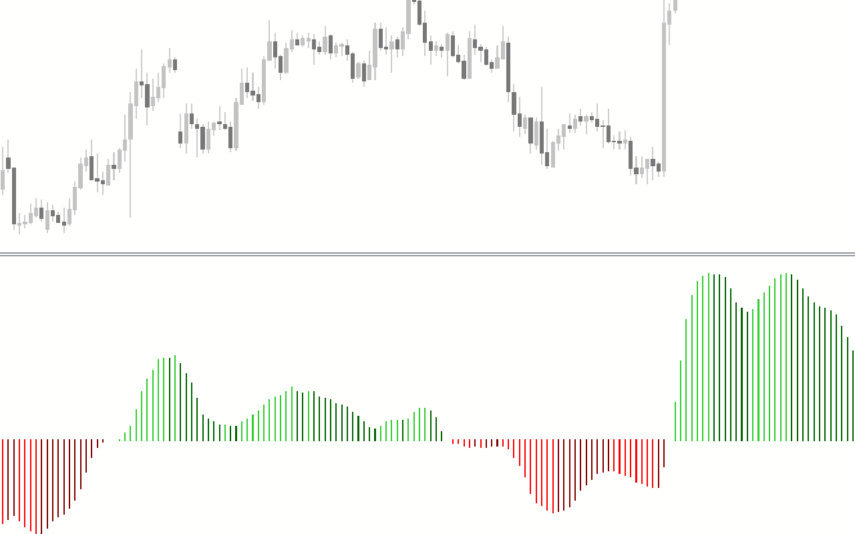
The indicator primarily helps traders identify the trend condition of an instrument. It shows when the RSI is swinging to the upside or downside, which suggests bullish and bearish strength, respectively. So, for instance, if the green line moves continually to the upside, it implies that the RSI is bullish on the H4 timeframe, which suggests a potential up trend.
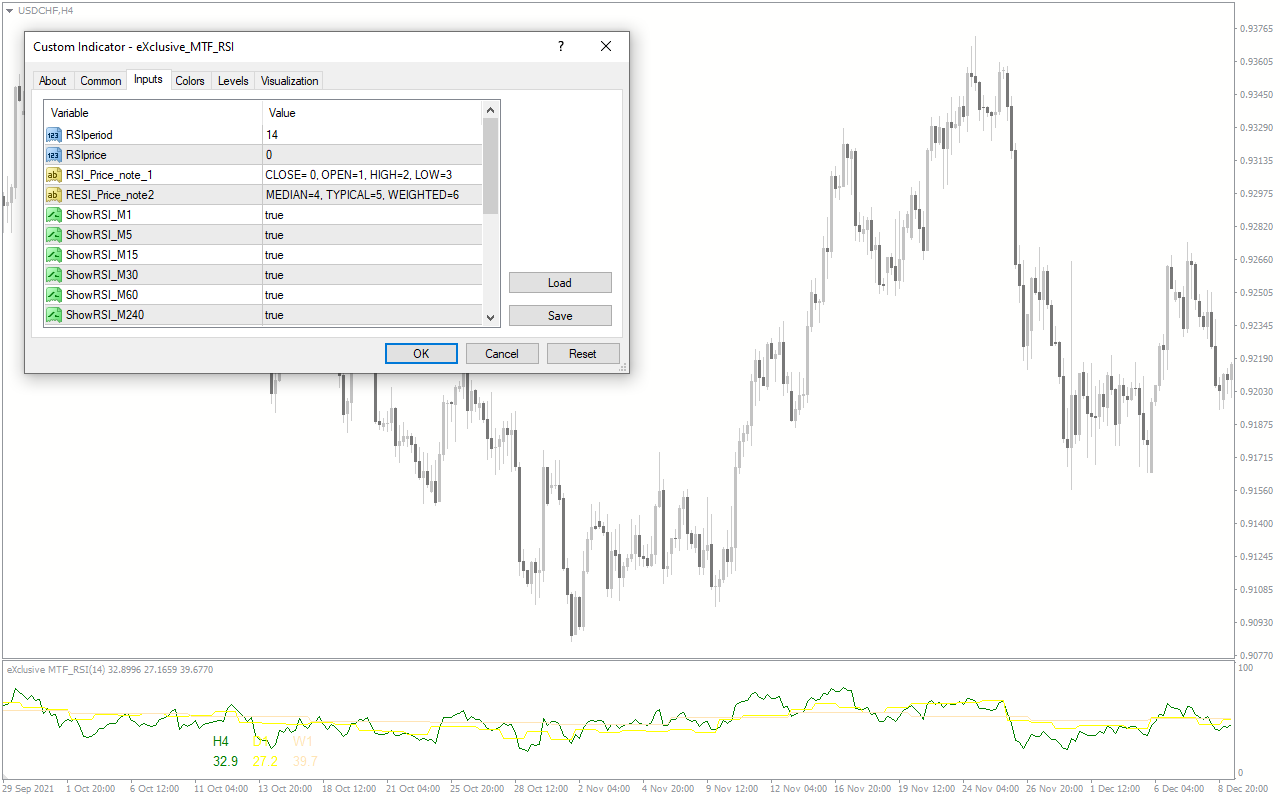
The indicator comes with the following customizable settings:
RSIPeriod: Determines the period for RSI calculation.
RSIPrice: Defines the price for RSI calculation.
ShowRSI_M1 to M10080: Enables/Disables the display of RSI reading on the M1 through the W1 timeframes.
M1 to M10080_Color: Determines the individual colors to display the RSI reading on the M1 through the W1 timeframes.
 Nếu bạn muốn tham gia giao dịch trên thị trường Forex, Vàng,…. bạn hãy ủng hộ admin bằng cách đăng ký sàn theo link dưới nha! Cảm ơn bạn rất nhiều


 Sàn Exness: https://one.exnesstrack.net/a/6meoii18rp
 Mã giới thiệu: 6meoii18rp


